Maps represent undergrounds and underworlds in various ways: as burial maps, sewage maps, subway maps, infrastructure maps, groundwater maps, geological maps, and mining maps, to name only a few. The underground can also be depicted as an angle, as depth, elevation, the cross-section, and verticality in all its forms. Furthermore, the underground is sometimes represented figuratively, especially when a map seeks to illustrate social or political relations: there are underground movements, a criminal “underworld”, and whole populations and mobilities that fall into conceptual abysses. This experimental workshop explored multiple readings of maps by drawing on geographical, cartographical, anthropological, artistic, poetic, literal, sociological, and historical methods.
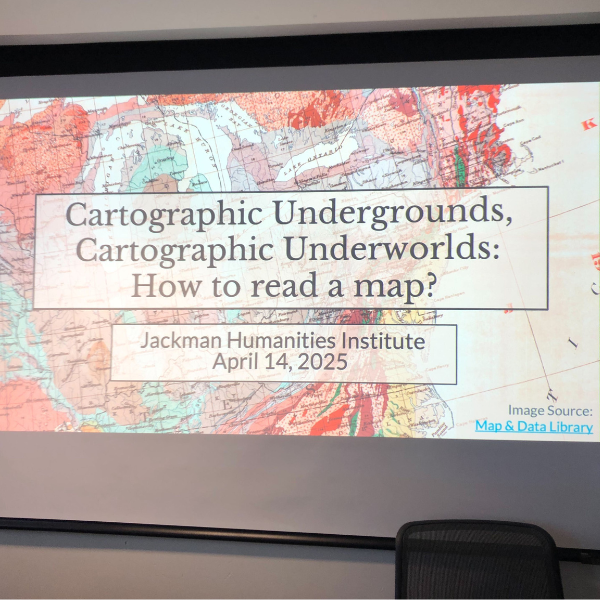
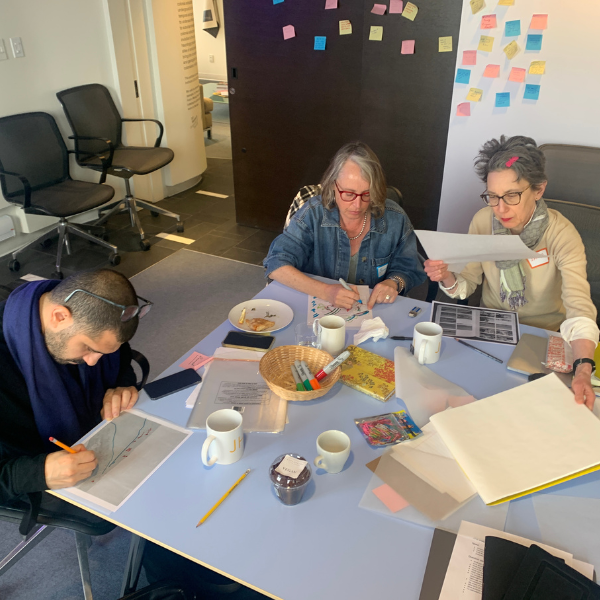
Guided by the 2024-2025 JHI theme, “Undergrounds and Underworlds”, on April 14, 2025, seventeen researchers gathered to share their map-related work. The day-long workshop, entitled “Cartographic Undergrounds, Cartographic Underworlds: How to read a map?”, was organized by Alaa Attiah Mitwaly, JHI Graduate Fellow and PhD Student, Anthropology; Nick Field, Data Support Specialist at the Map & Data Library, University of Toronto Libraries; and Chloe Bordewich, JHI New Media and Public Humanities Postdoctoral Fellow. Presenters were diverse, including an undergraduate student, senior faculty, librarians, staff, and an artist, and they came from a wide range of disciplines: Anthropology; Architecture, Landscape, and Design; History; the History and Philosophy of Science and Technology; Islamic Studies; Latin American Studies; Religion; and Women and Gender Studies.
Over the course of the workshop, several intertwined themes emerged. Many speakers touched on how water, whether as rivers (as infrastructural opportunities, as sites of nostalgia and personal meaning), polluted lakes, groundwater or sewer water below the surface, or coasts cycling between droughts and floods, resisted static modes of mapping yet tied disparate groups together. On a similar track, many speakers noted how the complexities of changing landscapes and territories required triangulating changes across time, via map series, historical maps, and geospatial data. Additionally, presenters shared an abundance of cartographic forms: in addition to historical maps, they shared aerial photographs, infrastructural plans, treaty maps, maps as colonial imaginings, altars as maps, geospatial boundary files, glossy web maps, personal notebooks, knowledge of winds and tides shared orally, and a variety of maps they made themselves. We were delighted to see such a variety in perspectives and formats, and look forward to watching these projects as they develop.